- Joined
- Mar 21, 2017
- Messages
- 2
- Reaction score
- 0
- Country

Hello, I've had this question for a while and have not been able to figure out the math by myself and could use some help. I often run variance analysis' for sales volume and need to figure out what metrics are driving the variance, and how much each metric is contributing to the overall favorability or unfavorability of sales compared to budget.
The issue I have is when I have multiple components, if I were to add up the sum of variance analysis for each component, I get different results than when I do a variance analysis when all components are combined. Basically the sum of the parts don't equal the whole.
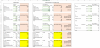
I have attached a screenshot from excel of what I mean. It is broken into 3 components (A, B, and C) and there is a variance analysis performed in column E for each one. Starting on row 23, I am showing the 2 methods that I am trying to reconcile.
Method 1- adds up all the individual components from above; Method 2- run my own variance analysis using the total metrics.
The area highlighted in yellow should be equal, regardless of the method, but it clearly is not. I believe this is due to volume mix not being taken into account properly in Method 1, but I am unsure how to adjust for it.
Can someone please help reconcile the 2 methods? Thanks for your help!
The issue I have is when I have multiple components, if I were to add up the sum of variance analysis for each component, I get different results than when I do a variance analysis when all components are combined. Basically the sum of the parts don't equal the whole.
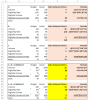
I have attached a screenshot from excel of what I mean. It is broken into 3 components (A, B, and C) and there is a variance analysis performed in column E for each one. Starting on row 23, I am showing the 2 methods that I am trying to reconcile.
Method 1- adds up all the individual components from above; Method 2- run my own variance analysis using the total metrics.
The area highlighted in yellow should be equal, regardless of the method, but it clearly is not. I believe this is due to volume mix not being taken into account properly in Method 1, but I am unsure how to adjust for it.
Can someone please help reconcile the 2 methods? Thanks for your help!
Attachments
-
 49.6 KB Views: 499